SQDCP Logic
Digital Performance Boards
Replace paper boards and spreadsheets with real-time digital SQDCP boards. Safety, Quality, Delivery, Cost, and People — all five pillars tracked, visualised, and actioned through a single platform. Fully integrated with the Oplytics.Digital operational excellence ecosystem.
See It In Action
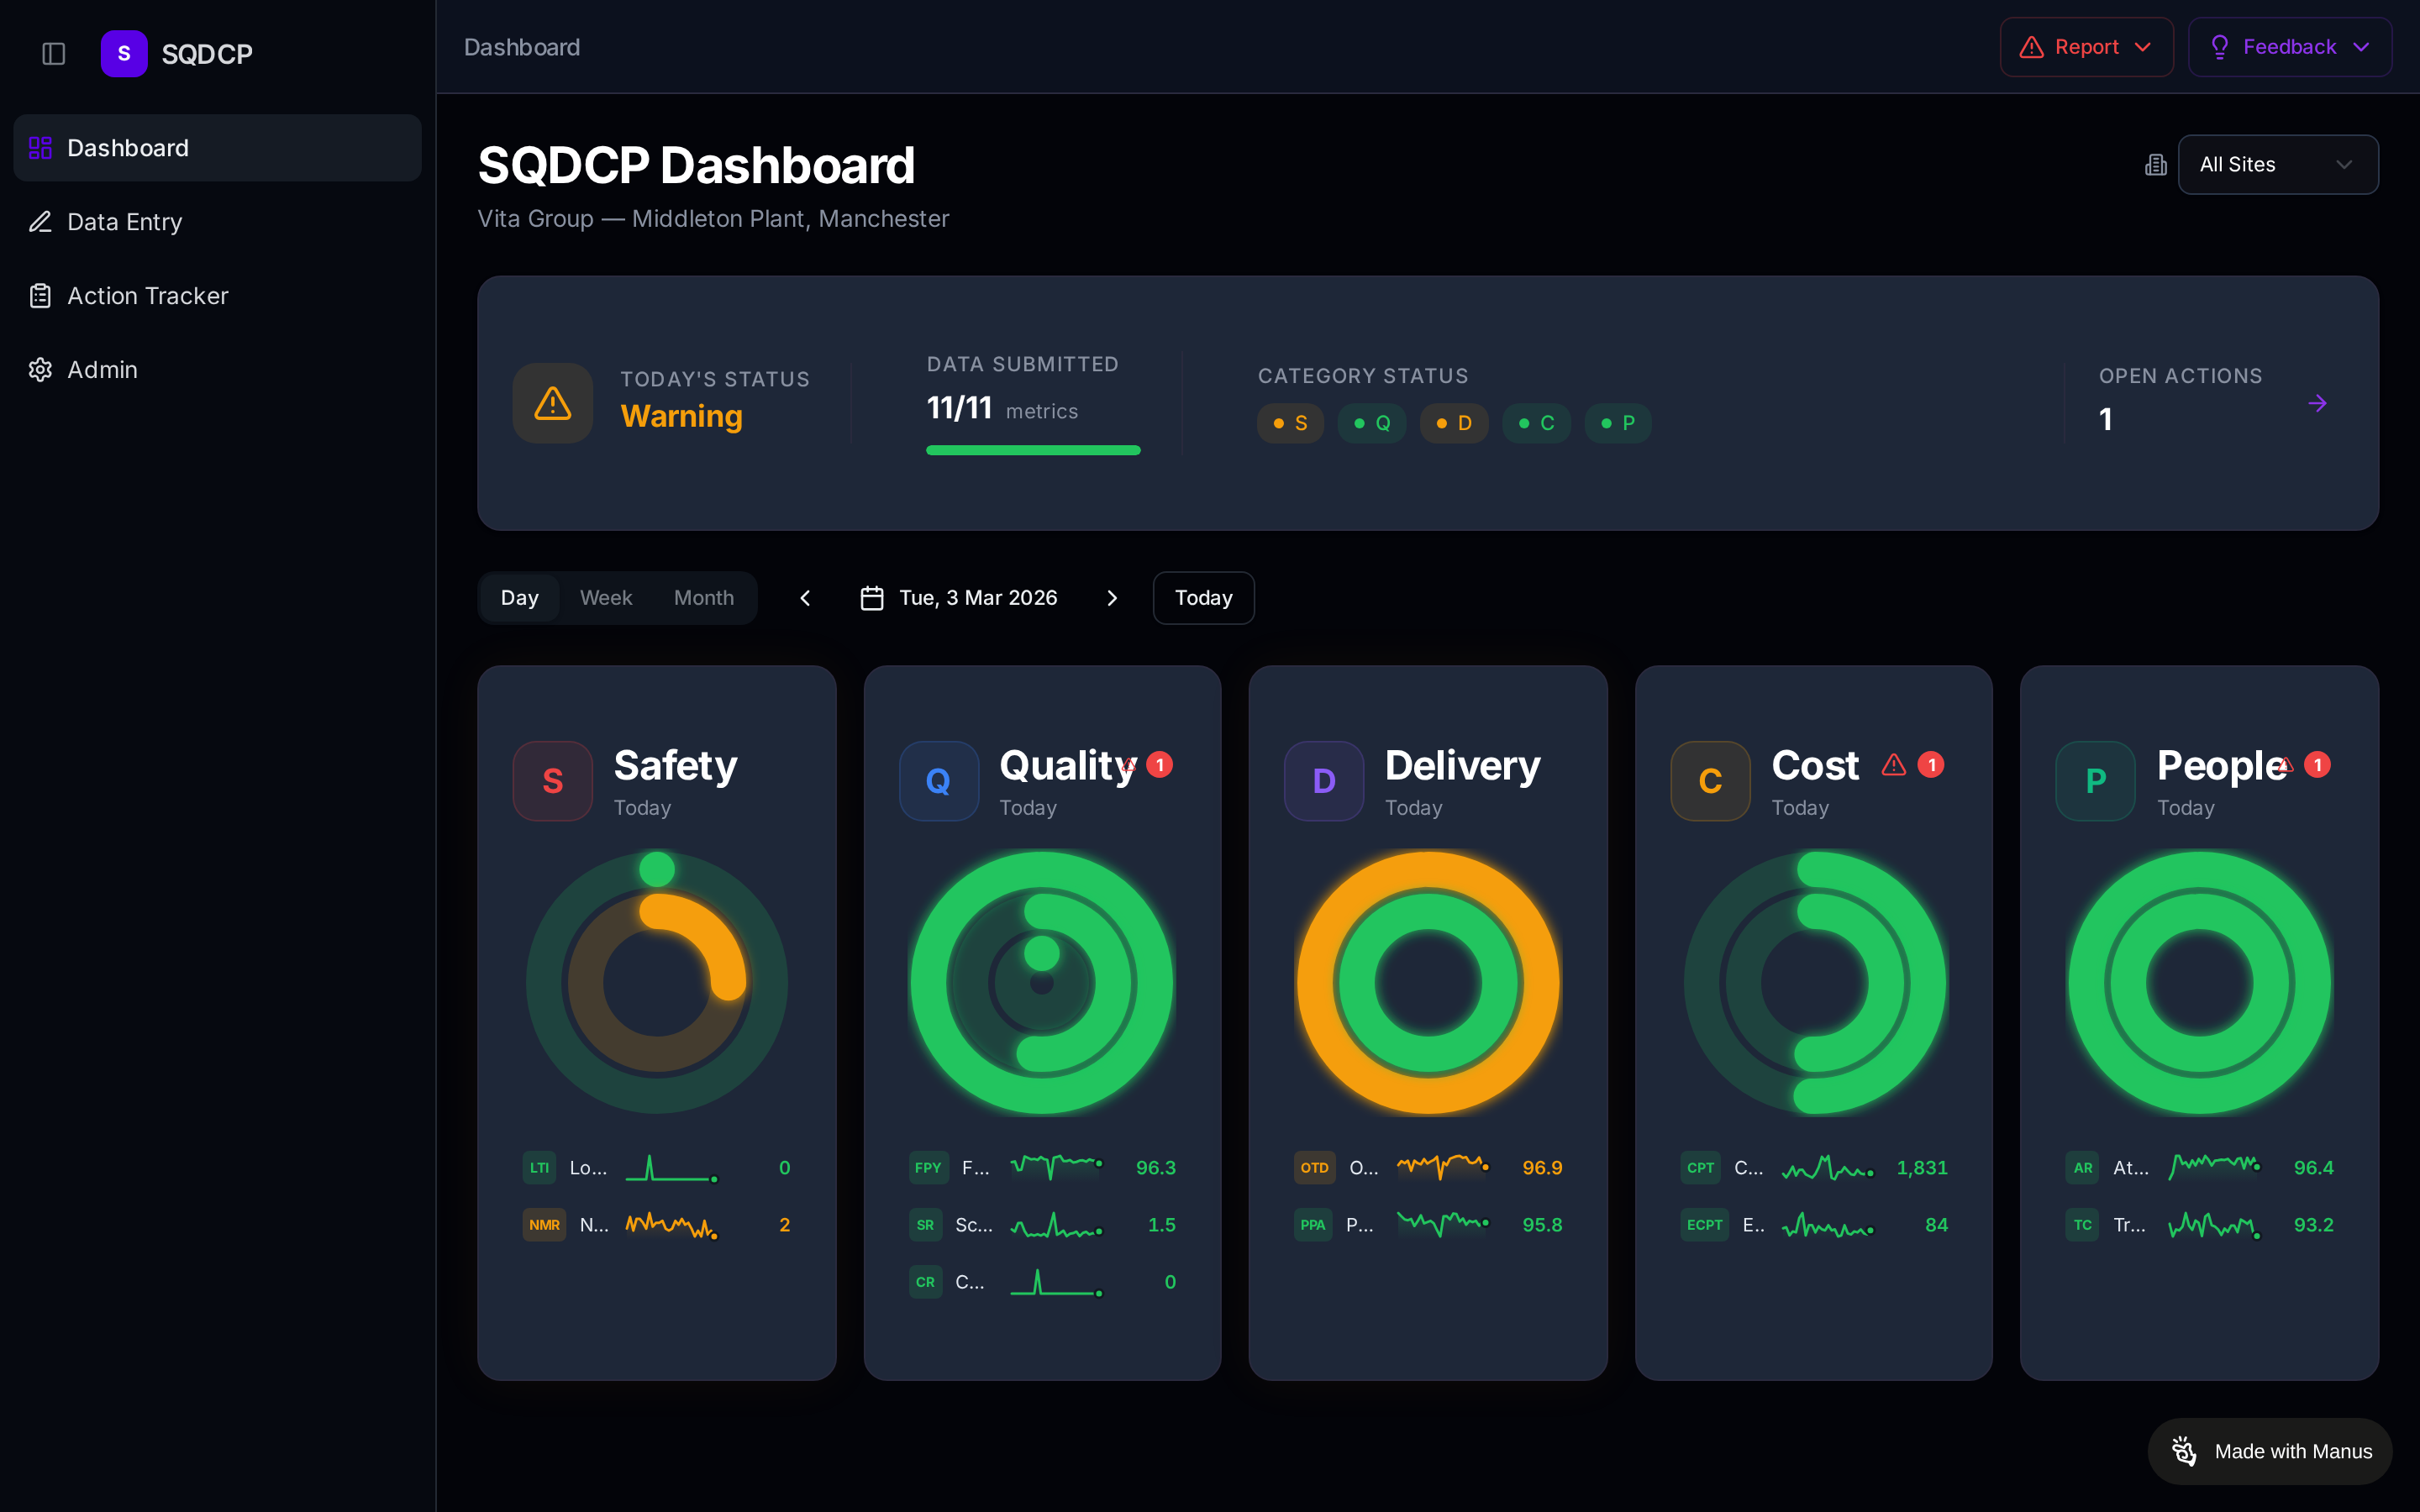
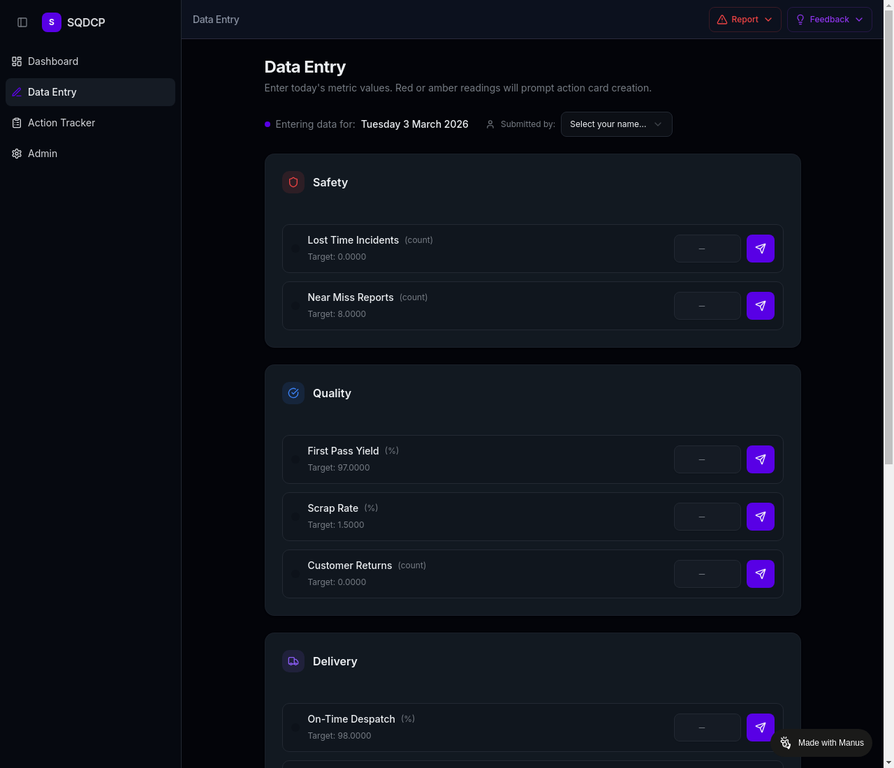
Real screenshots from the live SQDCP application at sqdcp.oplytics.digital — five-pillar dashboards, structured data entry, and integrated action tracking.
Complete SQDCP Management Suite
Real-Time Visual Boards
Five-pillar SQDCP boards with traffic-light status indicators updated in real time. See the health of your operation at a glance — from individual lines to enterprise-wide performance.
Instant Issue Escalation
Red items on any pillar automatically generate actions with named owners and due dates. Escalation rules ensure nothing falls through the cracks between tier meetings.
Trend Analysis & History
Track every metric over days, weeks, and months. Identify recurring patterns, seasonal variations, and the impact of improvement initiatives. Data-driven decisions, not gut feel.
Tier Meeting Support
Purpose-built views for each tier meeting level — from 10-minute shop floor stand-ups to monthly enterprise reviews. Agenda templates, action capture, and automatic minutes.
Smart Notifications
Automated alerts when metrics breach thresholds, actions are overdue, or escalation is needed. Delivered via email, in-app notifications, or integrated with your existing communication tools.
Platform Integration
SQDCP data flows directly into Action Manager for tracking, OEE Manager for machine context, and Policy Deployment for strategic alignment. One platform, one data pipeline.
Structured Tier Meetings
SQDCP Logic supports the full tiered meeting structure — from 10-minute shop floor stand-ups to monthly enterprise reviews. Each tier aggregates data from the level below, creating a clear escalation path from operator to boardroom.
Operators review yesterday's SQDCP status at the board. Red items generate immediate actions. Green items are acknowledged. New issues are raised and captured.
Supervisors review escalated items from Tier 1 boards. Cross-functional issues are identified. Resource allocation decisions are made. Unresolved items escalate to Tier 3.
Site managers review aggregated SQDCP performance. Strategic themes are identified from recurring issues. Capital investment decisions are informed by data trends.
Enterprise leadership reviews cross-site SQDCP performance. Best practices are shared between sites. Strategic alignment with Hoshin Kanri objectives is verified.
All Handled in One Platform
SQDCP boards don't exist in isolation. Through the Oplytics.Digital platform, board data feeds directly into action tracking, OEE analysis, and strategic policy deployment — creating a complete operational excellence ecosystem.
SQDCP → Action Manager
Red items on any pillar automatically create action cards with owners, priorities, and due dates. Track every corrective action from identification to verified closure.
SQDCP → OEE Manager
Quality and delivery metrics from SQDCP boards correlate with machine-level OEE data. Identify whether performance issues originate from equipment, process, or people.
SQDCP → Policy Deployment
Aggregated SQDCP trends feed into Hoshin Kanri bowling charts and strategic KPIs. Shop-floor reality informs boardroom decisions through a single data pipeline.
Measurable Operational Gains
One Platform, Multiple Solutions
SQDCP Logic is part of the Oplytics.Digital ecosystem. Each solution drives efficiency through proven lean and continuous improvement methodologies.
SQDCP Logic
Digital performance boards for Safety, Quality, Delivery, Cost, and People.
You are hereOEE Manager
Automated OEE analysis with smart device integration and real-time dashboards.
ExplorePolicy Deployment
Hoshin Kanri strategy deployment with X-Matrix, bowling charts, and catchball.
ExploreAction Manager
Track every action from every module — owned, prioritised, and closed.
ExploreOplytics Connect
Plug-and-play IoT hardware integration for real-time data capture.
ExploreReady to Digitise Your SQDCP Boards?
Whether you're running paper-based boards or looking to upgrade from spreadsheets, we'll design the right SQDCP solution for your operation. From single-site pilot to enterprise-wide rollout.